-
Product Management
Software Testing
Technology Consulting
-
Multi-Vendor Marketplace
Online StoreCreate an online store with unique design and features at minimal cost using our MarketAge solutionCustom MarketplaceGet a unique, scalable, and cost-effective online marketplace with minimum time to marketTelemedicine SoftwareGet a cost-efficient, HIPAA-compliant telemedicine solution tailored to your facility's requirementsChat AppGet a customizable chat solution to connect users across multiple apps and platformsCustom Booking SystemImprove your business operations and expand to new markets with our appointment booking solutionVideo ConferencingAdjust our video conferencing solution for your business needsFor EnterpriseScale, automate, and improve business processes in your enterprise with our custom software solutionsFor StartupsTurn your startup ideas into viable, value-driven, and commercially successful software solutions -
-
- Case Studies
- Blog
7 Best Mobile Analytics Tools
Your app metrics are like feedback from real users. Metrics can give you a lot of insights to figure out how to improve your app, make it more efficient, and more useful. However, measuring and analyzing these metrics is an art that requires knowledge and a reliable tool. In this article, we compare the top seven mobile app analytics platforms and find out what data you really need to keep track of and what data is irrelevant for your business.
Which metrics to consider and which to ignore
It may seem that all data you get from your analytics tool is equally important. But that’s not true. Some metrics (even if they look really inspiring) can be irrelevant for your business. They’re called vanity metrics.
Vanity metrics
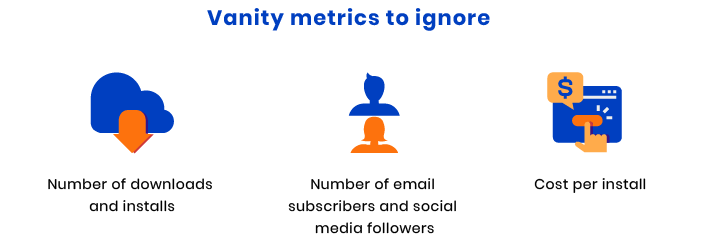
Vanity metrics don’t reflect the true results of your app. Such numbers can be collected. However, you shouldn’t use them for building your business strategy. Below, we list the metrics that most commonly cause confusion:
- Number of downloads and installs. When this metric grows, it can be very exciting. However, this metric doesn’t show how successful your product is. According to Andrew Chen, almost 80 percent of users will leave your app within the first three days after they download it. That’s why this metric can’t be used to measure your business development.
- Number of email subscribers and social media followers. A lot of subscribers don’t necessarily mean you have a large community. It’s much better to check how many people open your emails and are active on your social pages.
- Cost per install. This number matters only for accurate cost accounting. Still, it doesn’t provide meaningful guidance for a business’s unit economics.

All these measures can be helpful and informative to some extent. But they can’t help you build an information-driven strategy for improving your app.
Now let’s take a deeper look at the numbers that can have a real impact on your product.
Actionable metrics
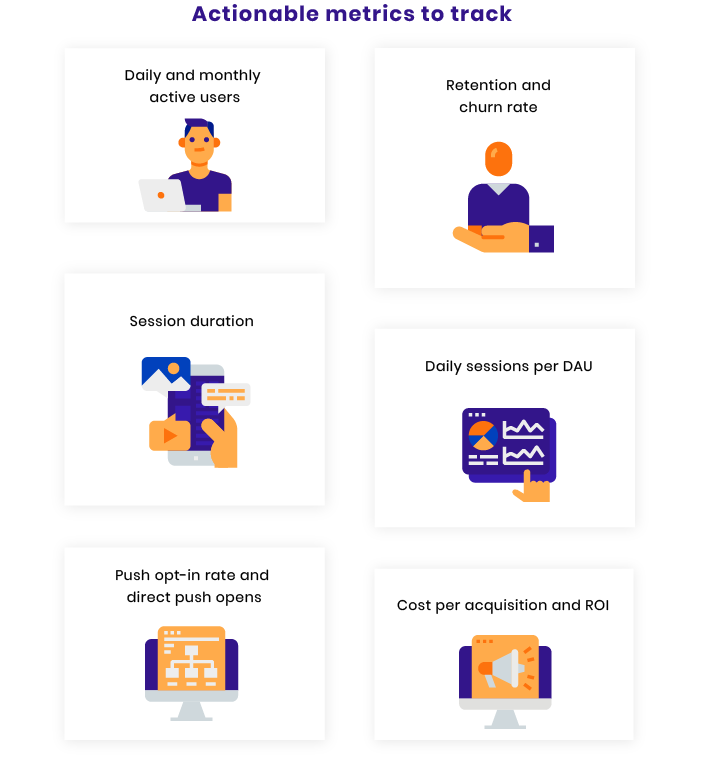
Actionable metrics reflect the true state of your app. They show all the weaknesses of an app to help you map strategies for the future. Here are the analytics you should pay attention to:
- Daily and monthly active users. These metrics show how many customers your app really has and how your product performs over time.
- Retention and churn rate. These numbers reflect the actual size of your app’s audience. Track them to see growth over the months.
- Session duration shows the time a user spends in your app per session. This metric can detect UX issues and user engagement. A short session doesn’t necessarily mean that the app performs badly. Session duration should correlate with the type of product.
- Daily sessions per daily active users (DAU). This metric gives an idea of how often customers open your app per day. It’s a crucial metric for apps that require a high level of user engagement (games, social apps).
- Push opt-in rate and direct push opens. These measures can show you what category of customers and how many of them want to be notified by your app and how well these push notifications perform.
- Cost per acquisition and return on investment (ROI). This data is crucial for understanding how your marketing campaign is doing.

The full list of actionable metrics depends on your app and business type. The most critical step is to collect metrics that have a tangible impact on your product performance and ignore those that don’t provide you with enough insights.
Top 7 mobile app analytics platforms
Now that you have a clearer conception of the metrics you need to track, it’s time to choose the most effective app analytics tool for you. Let’s take a look at the top seven mobile app analytics platforms according to scores on G2.com, a software user reviews platform. All these platforms support both iOS and Android mobile apps.
#1. Google Analytics
Google Analytics provides businesses with comprehensive insights on their apps, users, and marketing campaigns. You can use this platform for free to analyze and improve user acquisition and retention. Google Analytics offers an easy-to-use SDK to help you track revenue and conversions and displays how visitors use your product.
Main features:
- Track number of users and sessions
- Measure session duration
- Analyze operating systems and device models
- Measure user activities
- Track in-app payments and revenue
- Create customized analytics reports
- Generate heat maps of user navigation paths
- Integrate with Google Play for conversion tracking
- Multiple filters
- Goals
The main drawback of Google Analytics is the lack of iTunes integration and absence of cohort analysis.
#2. Firebase
Firebase also provides a free SDK for iOS and Android. This platform can be easily integrated with other Firebase tools like Remote Config and Cloud Messaging.
Main features:
- Send notifications to customers after a certain analytics event in the app
- Use Remote Config to create personalized experiences in the app
- Perform A/B testing of Remote Config feature
- Track crash data
- Track notification effectiveness
- Collect in-app purchase data
As for the downsides, Firebase shows only 50 event parameters in reports and doesn’t allow businesses to create custom reports.
#3. Mixpanel
The Mixpanel SDK is a powerful event-based analytics tool that allows clients to learn user behavior and translate it into actionable knowledge. Mixpanel tracks user activities and reveals important insights to help businesses make data-driven decisions. Among the most famous clients of Mixpanel are BMW, Hinge, Samsung, Expedia, and OpenTable. The tool has a free set of tools and advanced paid packages.
Main features:
- Create customized reports
- Show user segmentation
- Build user activity heatmaps
- Track conversion and retention
- Set customized alerts
- Perform cohort analysis
- Provide data science models for predicting user behavior patterns
- Create an activity feed for every customer where all activities are stored
The only downside of this tool is a data points limit in the free package.
#4. Pendo
Pendo has a unique toolset that allows businesses to not only analyze user behavior patterns but also detect weak features that customers ignore. The platform offers functionality to set up in-app surveys that are a great source of insights for businesses and can be used to improve general user experience and increase revenue. What’s more, Pendo allows developers to inform users about new functionality in an app and provide them with guidance on how to use it. Pendo isn’t a free platform; however, you can test it with a free demo.
Main features:
- Analyze user actions
- Perform user segmentation
- Collect user feedback
- Analyze trends
- Create custom in-app surveys for better response rates
- Provide in-app guides for new features
The main drawback of Pendo, according to its users, is slow loading of the dashboard and poor cohort analysis.
#5. Flurry Analytics
Flurry Analytics is a free SDK with a range of versatile instruments built in. These instruments offer comprehensive information on your app customers behavior. The instrument analyzes complex events and builds reports with numerous metrics. This instrument helps businesses analyze apps for bottlenecks and eliminate all drop-off points.
Main features:
- Track real-time metrics and session activities
- Perform revenue analysis
- Track crash data
- Provide demographic information
- Track users paths and funnels
- Create custom dashboards
- Push notifications to re-engage users
- Numerous filters
The main drawback of this tool is its complicated interface.
#6. Amplitude
Amplitude is an analytics platform that interprets user actions to help you form the right feature set. It aims to answer such crucial questions for businesses as:
- Which features are the most engaging?
- How can we improve the user experience within the app?
- How can we increase long-term user retention?
Among the most famous clients of Amplitude are PayPal, Booking.com, Twitter, and Hubspot.
The core functionality is free. To get access to advanced features, you’ll need to buy a Growth or Enterprise package.
Main features:
- User behavior analytics
- Heat maps of user activities
- Track marketing campaigns
- Track impact of changes in an app
- Categorize users based on their engagement across all features
- Compare stickiness of old and new features
- Personalize in-app messages
- Analyze conversion flow
The main disadvantage of Amplitude is its complexity; it can be overwhelming for a beginner.
#7. Smartlook
The Smartlook analytics toolset aims at giving you an explanation of users’ behavior in your app beyond numbers. The platform records and tracks user activities to show you who, how and what does to your app. The platform gives you comprehensive information to improve retention and conversion rates. Smartlook offers a very limited free package and packages with more features for €19 and €79 per month.
Main features:
- Track issues
- Numerous filters
- Customer segmentation
- Analyze user behavior
- Create customer profiles
- Track the customer journey
- Provide funnel analytics
- Track in-app events
- Monitor engagement
This tool is powerful and versatile; however, some users are confused by the different UIs of the dashboard and admin panel.
The bottom line
Tracking mobile app analytics is crucial for your business success. With the right data, you can eliminate guessing and map your plan for future development.
Today, there are hundreds of effective and powerful mobile app analytics platforms. To make your life easier, we’ve narrowed your choice to the most effective and agile of them. If you want to stay updated and get more useful insights from us, subscribe to our blog!


